3. Storperf Reporting Module
3.1. About this project
- This project aims to create a series of graphs to support the SNIA reports.
- All data for the reports can be fetched either from the OPNFV Test Results DB, or locally from StorPerf’s own database of current run data.
- The report code may be stored in either the Releng repository (so it can be included in the Test Results Dashboards), or locally in StorPerf’s own git repository.
- The report (generated by the reporting module) looks like the following example:
3.2. Usage
- Enter the URL for the location of the data for which you want to generate the report(http://StorPerf:5000/api/v1.0/jobs?type=metadata).
- Note: You can test the module using the testdata present in the directory
storperf-reporting/src/static/testdata. Instead of the URL enter the filename present in the testdata directory, eg. local-data.json
- After entering the URL, you are taken to the page showing the details of the all the jobs present in the data.
- Click on the Click here to view details to see the different block sizes for the respective job.
- Click on the block size and select the parameter for which you want to view the graph.
3.3. Graph Explanation
Example of a graph generated is shown below:-
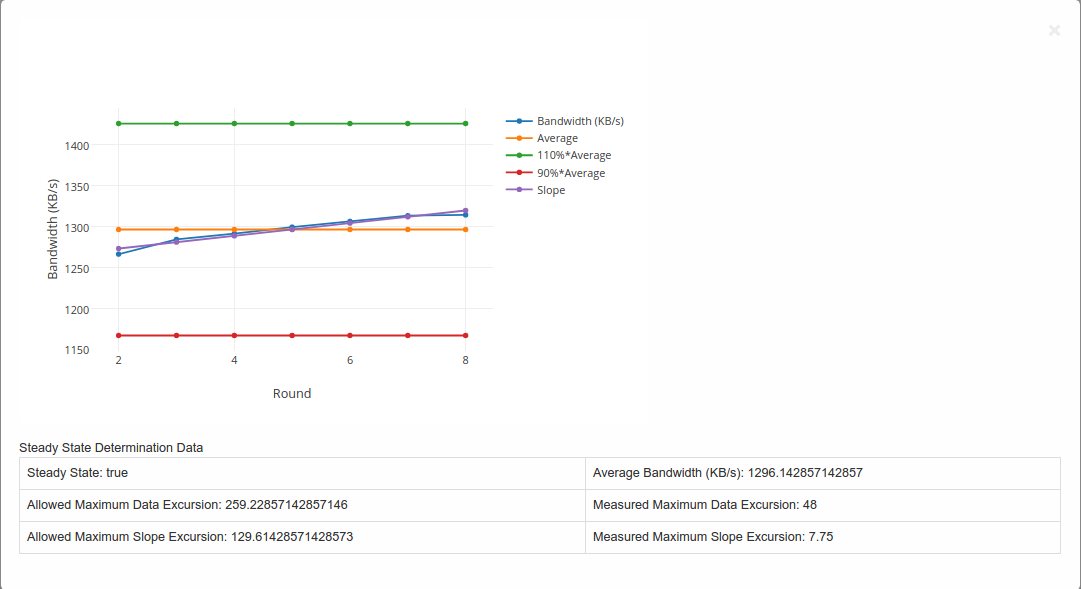
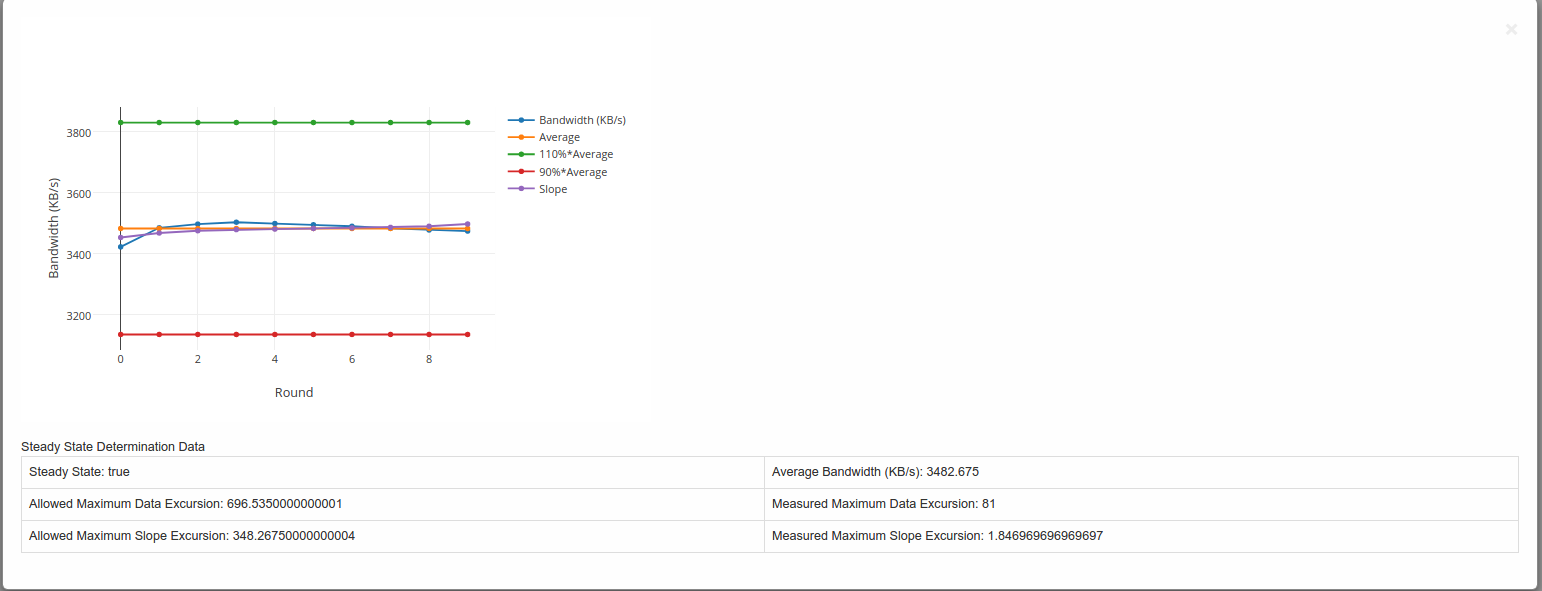
Steady State Convergence Graph
- This graph shows the values as reported by StorPerf for the actual and average throughput.
- Also shown is the average +-10% and the slope.
- It serves to visually demonstrate the compliance to the steady state definition.
- The allowed maximum data excursion is 20% of the average (or average x 0.20)
- The allowed maximum slope excursion is 10% of the average.
- The measured data excursion is the value from range.
- The measured slope excursion is the value from range
3.4. Workflow
A Flask server is used to fetch the data and is sent to the client side for formation of the graphs (Using Javascript).
3.4.1. Steps involved
- Step 1: Data is fetched from the OPNFV Test Results ReST API
- Step 2: The fields “report_data” and “metrics” are taken from the JSON object retrieved in the above step and sent to the client side.
- Step 3: The “report_data” is obtained by the client side and a parser written in Javascript along with Plotly.js forms the graphs.
3.5. Directory structure
storperf/docker/storperf-reporting/ contains the code used for this project.
The file structure is as follows:-
storperf-reporting
|+-- Dockerfile                         # Dockerfile for the storperf-reporting container
|+-- requirements.txt                   # pip requirements for the container
+-- src                                 # Contains the code for the flask server
    |+-- app.py                         # Code to run the flask application
    |+-- static                         # Contains the static files (js,css)
    |   |+-- css                        # Contains css files
    |   |   `-- bootstrap.min.css
    |   |+-- images
    |   |+-- js                         # Contains the javascript files
    |   |   |-- bootstrap.min.js
    |   |   |-- Chart.min.js
    |   |   |-- jquery-2.1.3.min.js
    |   |   |-- jquery.bootpag.min.js
    |   |   `-- plotly-latest.min.js    # Used for plotting the graphs
    |   `-- testdata                    # Contains testing data for the module
    `-- templates
        |-- index.html
        |-- plot_jobs.html
        |-- plot_multi_data.html
        `-- plot_tables.html