3. Storperf Reporting Module
3.1. About this project
This project aims to create a series of graphs to support the SNIA reports.
All data for the reports can be fetched either from the OPNFV Test Results DB, or locally from StorPerf’s own database of current run data.
The report code may be stored in either the Releng repository (so it can be included in the Test Results Dashboards), or locally in StorPerf’s own git repository.
The report (generated by the reporting module) looks like the following example:
3.2. Usage
Enter the URL for the location of the data for which you want to generate the report(http://StorPerf:5000/api/v1.0/jobs?type=metadata).
Note: You can test the module using the testdata present in the directory
storperf-reporting/src/static/testdata. Instead of the URL enter the filename present in the testdata directory, eg. local-data.jsonAfter entering the URL, you are taken to the page showing the details of the all the jobs present in the data.
Click on the Click here to view details to see the different block sizes for the respective job.
Click on the block size and select the parameter for which you want to view the graph.
3.3. Graph Explanation
Example of a graph generated is shown below:-
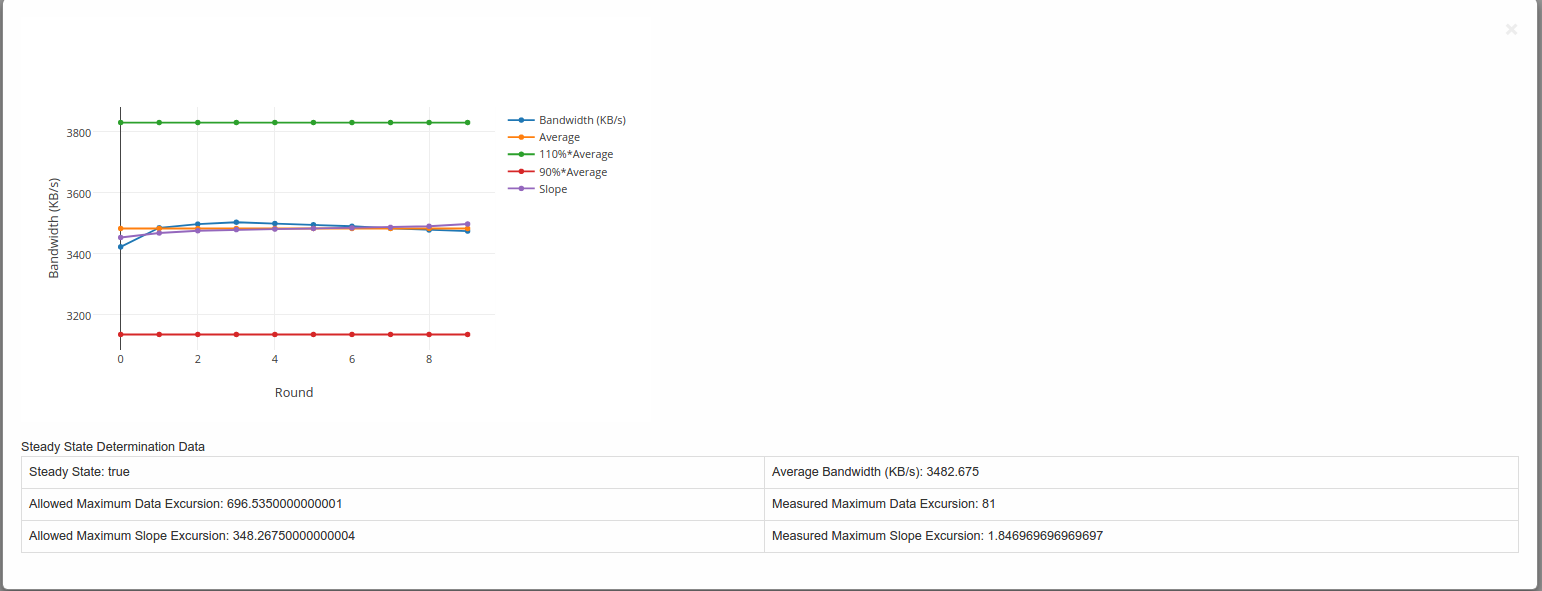
Steady State Convergence Graph
This graph shows the values as reported by StorPerf for the actual and average throughput.
Also shown is the average +-10% and the slope.
It serves to visually demonstrate the compliance to the steady state definition.
The allowed maximum data excursion is 20% of the average (or average x 0.20)
The allowed maximum slope excursion is 10% of the average.
The measured data excursion is the value from range.
The measured slope excursion is the value from range
3.4. Workflow
A Flask server is used to fetch the data and is sent to the client side for formation of the graphs (Using Javascript).
3.4.1. Steps involved
Step 1: Data is fetched from the OPNFV Test Results ReST API
Step 2: The fields “report_data” and “metrics” are taken from the JSON object retrieved in the above step and sent to the client side.
Step 3: The “report_data” is obtained by the client side and a parser written in Javascript along with Plotly.js forms the graphs.
3.5. Directory structure
storperf/docker/storperf-reporting/ contains the code used for this project.
The file structure is as follows:-
storperf-reporting
|+-- Dockerfile                         # Dockerfile for the storperf-reporting container
|+-- requirements.txt                   # pip requirements for the container
+-- src                                 # Contains the code for the flask server
    |+-- app.py                         # Code to run the flask application
    |+-- static                         # Contains the static files (js,css)
    |   |+-- css                        # Contains css files
    |   |   `-- bootstrap.min.css
    |   |+-- images
    |   |+-- js                         # Contains the javascript files
    |   |   |-- bootstrap.min.js
    |   |   |-- Chart.min.js
    |   |   |-- jquery-2.1.3.min.js
    |   |   |-- jquery.bootpag.min.js
    |   |   `-- plotly-latest.min.js    # Used for plotting the graphs
    |   `-- testdata                    # Contains testing data for the module
    `-- templates
        |-- index.html
        |-- plot_jobs.html
        |-- plot_multi_data.html
        `-- plot_tables.html
3.6. Graphing libraries and tools
Plotly.js is used as the graphing library for this project (Link: https://plot.ly/javascript/)
Bootstrap is used for the UI of the project.